Background
We, People Analytics practitioners, often time are mesmerized, then ultimately distracted by the fancy graphs that lead us away from our core value. Our primary focus should be on delivering actionable and quantifiable solutions that result in strategy formulation to overcome business challenges through our workforce. The insights should enable ROI calculation that allows leaders to make informed decisions about resource allocation for expected outcomes.
Talent Insight AI – Our Automated Analytics Platform
The Creation
Throughout my career in People Analytics, I’ve had the opportunity to discuss with many People Analytics technology vendors. However, I was unable to find a solution that would get to the bottom-line – solving the business challenges through people – directly and automatically. Fortunately, I finally had the opportunity to step away from my corporate life and dedicated the time with my team to develop the platform that I had always hoped someone would have pitched to me. The platform is designed to comprehensively address challenges over the entire employment lifecycle from hiring, performance, productivity, engagement to turnover. It is user-friendly, requiring no programming skill yet allowing user to run sophisticated, advanced models in the backend to produce powerful insights. The insight pinpoints the root causes of the challenges, and the platform provides actionable, measurable remedy to solve the challenges. Our team has overcome several technological hurdles to create a scenario planning feature on the platform, enabling users to adjust root causes and observe quantifiable improvements in real-time. The platform is illustrated at the end of the blog.
Your Insight Delivered Now – No System Implementation Required
Unlike most, if not all, of People Analytics technology solutions, our platform does not require any system implementation – delivering instant actionable insight without waiting for months working with IT and potentially another implementation consultants, costing another hundreds of thousands of dollars, before seeing the first metric. Our platform presents you with the bottom-line now!
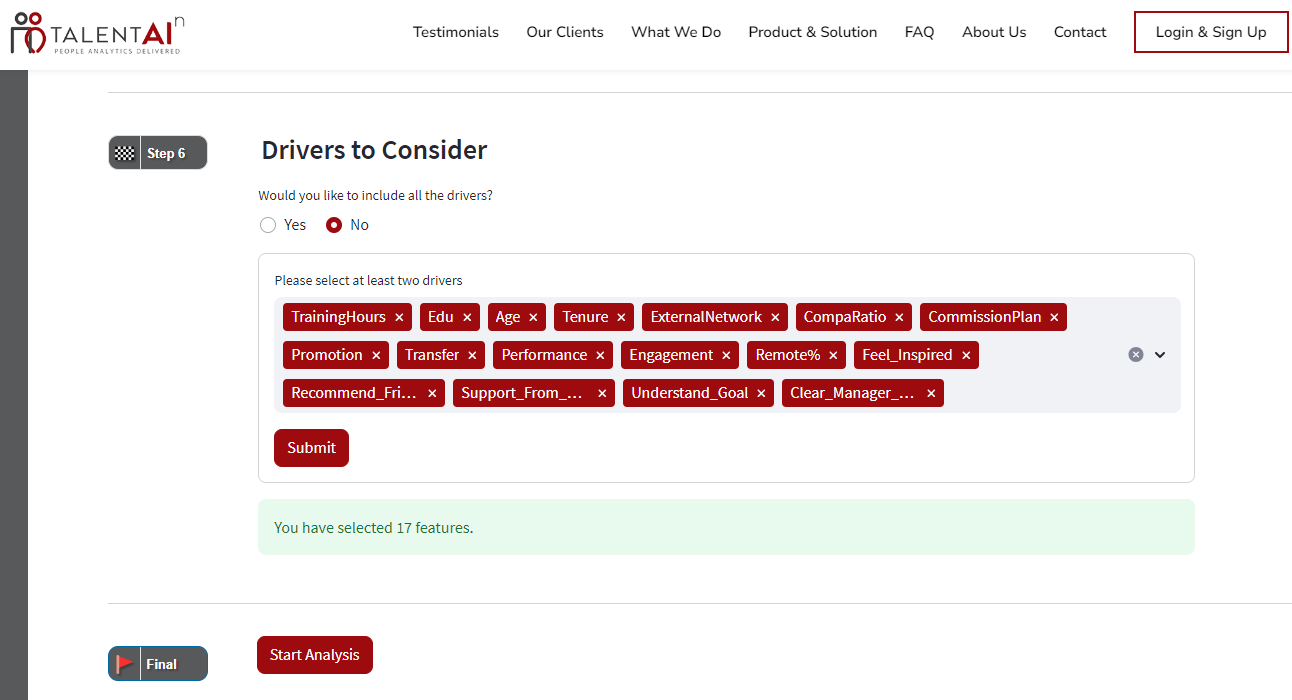
Users can access our platform via our secure web portal. Once logged in, the platform provides a step-by-step guide for users to upload their dataset before configuring the analytics model. For users who need help with getting to a clean slate of data to upload, we have an app for that, but it’s out of the scope of this blog. After uploading the data, users can select the workforce challenge to be addressed, i.e. the dependent variable, sample group of the study, and the hypothetical drivers of the challenges, i.e. independent variables. Now the entire model along with its criteria are set, users can simply hit the “run” button to execute the machine learning algorithm.
The Bottom-line
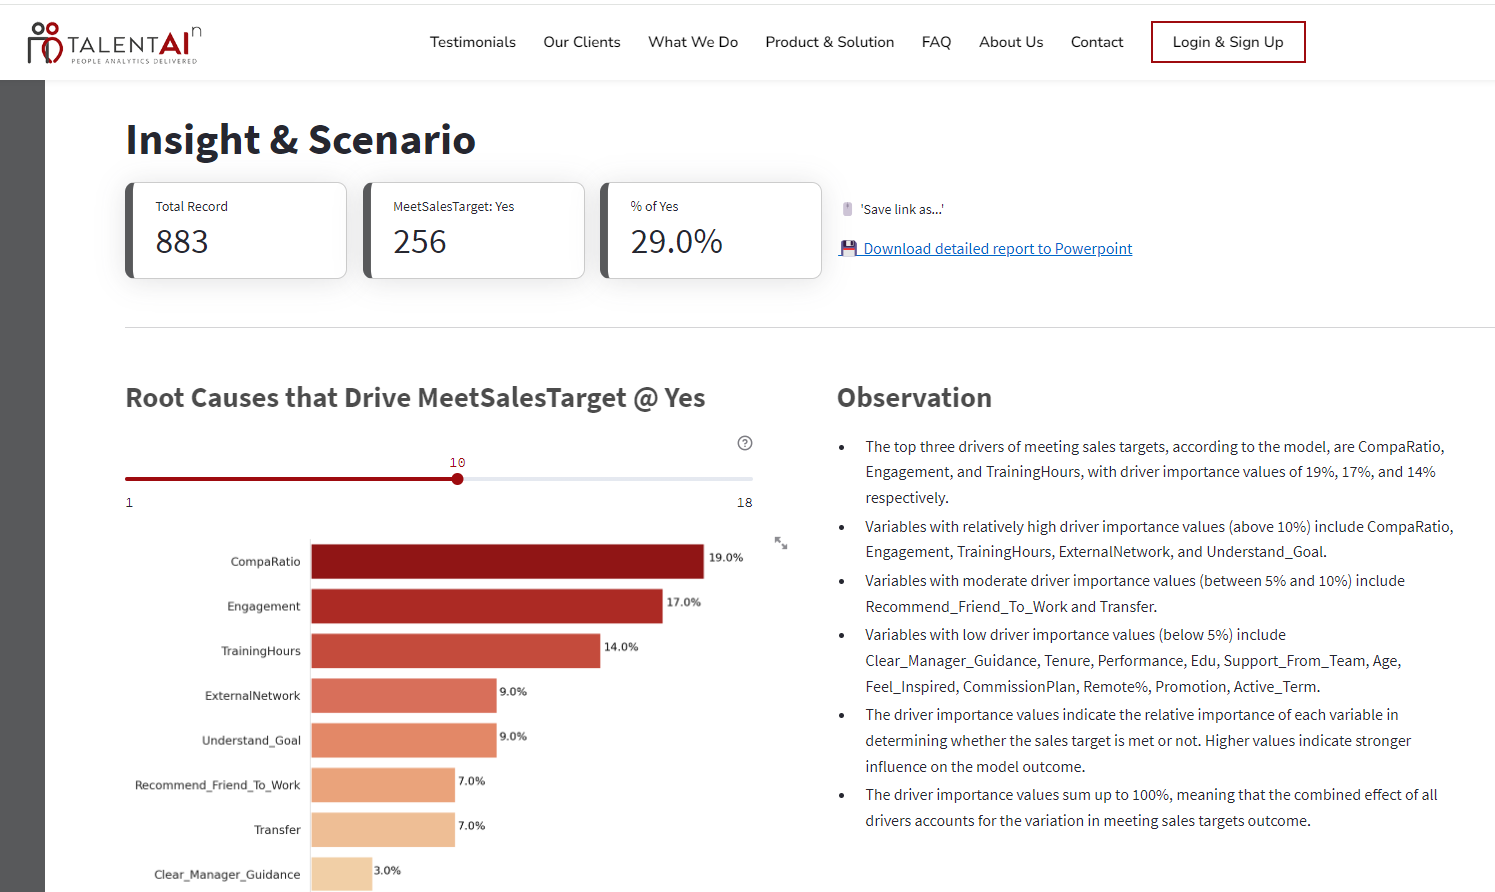
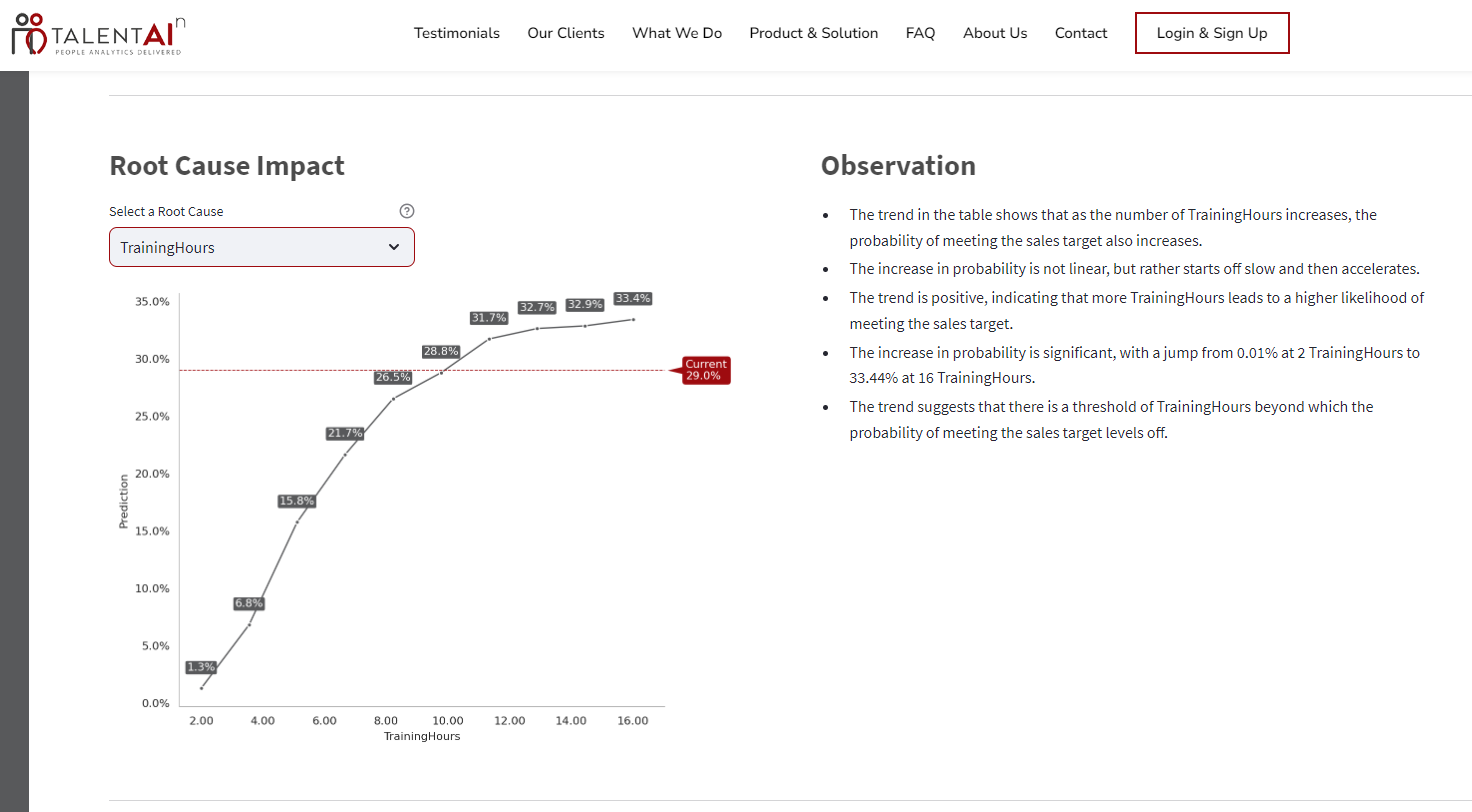
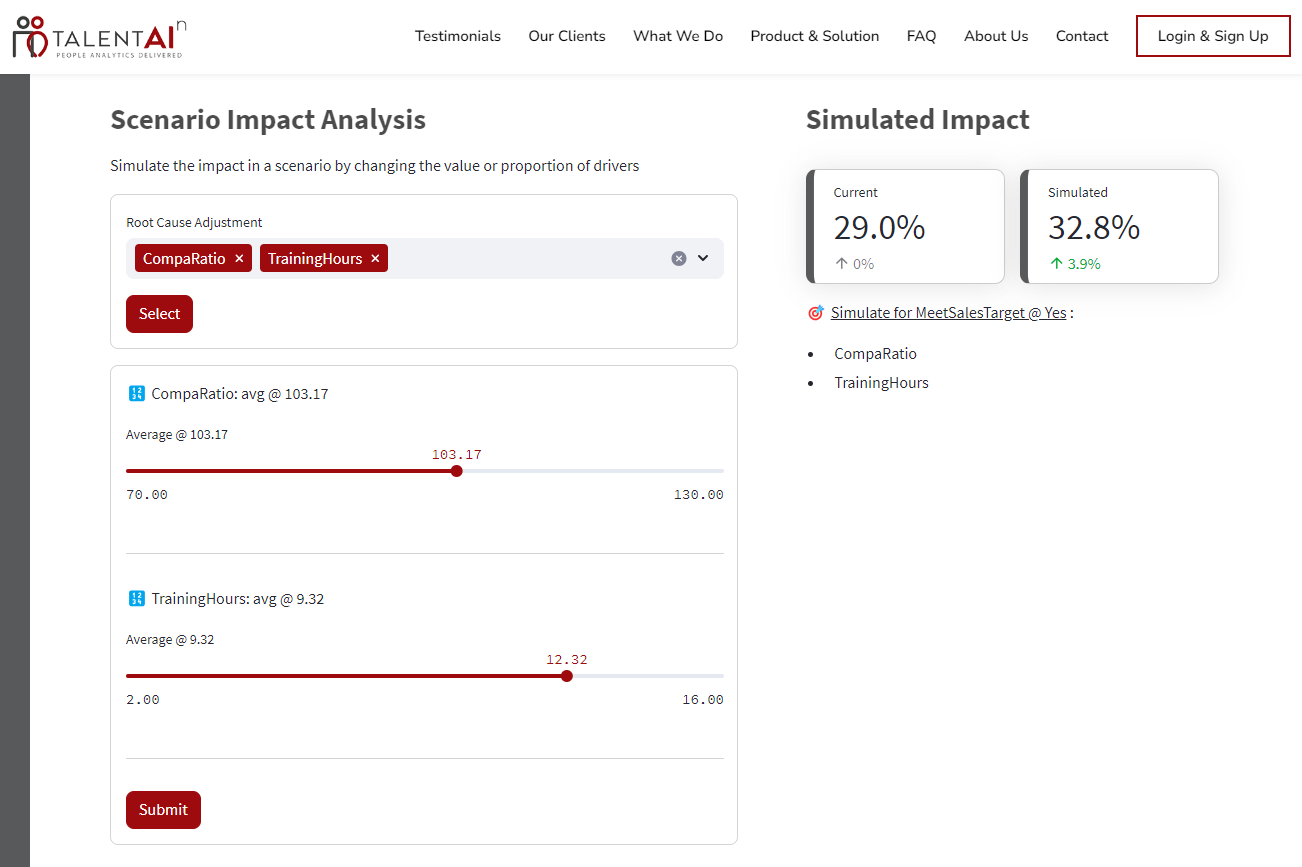
It takes our model about a minute or two to run before returning the insight. Here, the platform reveals the weight and ranking of the leading root causes (independent variables) to the specific workforce challenge (dependent variable) that a user is attempting to examine and solve. The platform also shows the Partial Dependent Plot (PDP) correlation between the root causes and the workforce challenge so that the user can understand how they are quantitatively related to each other. This result is followed by a scenario planning section where user can make adjustment on the root causes to see the impact of them on the challenge. For instance, if the model points out the propensity of meeting sales target is primarily influenced by training hours and external network, the user can select these two attributes in the scenario planning section and make quantifiable adjustment to them. Say the user increases the number of training hours by x hours per week and dials up external network by y% on average across the sales organization, the model will recalculate these parameters and return an estimated increase in the propensity of meeting sales target by z%. In other words, organizations are enabled with the right and optimal strategy to increase their revenue generation.
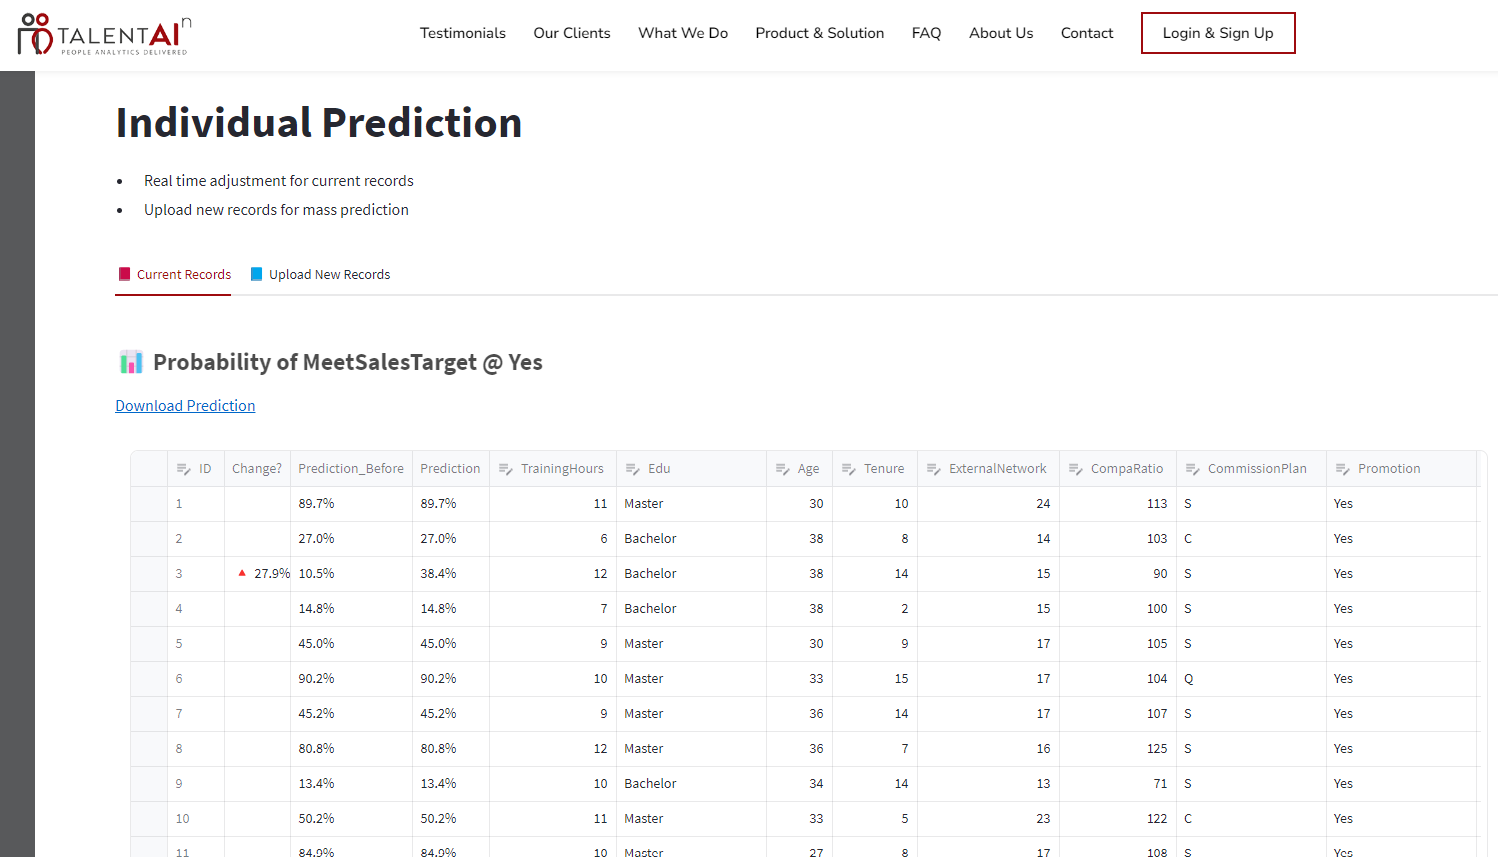
Our platform also allows drilling down the adjustments to employee level. Continuing with our example, a user or manager can assess a sales associate’s likelihood of meeting their sales targets and provide targeted support. If an associate is predicted to fall short of their sales target, the manager can determine the optimal additional training or networking needed to help them succeed.
This is the bottom-line or the so-what that People Analytics should deliver – a quantifiable and actionable solution to overcome workforce challenges. Not only it points out the root causes of a challenge, but it also offers an optimal solution to overcome it. Leaders no longer need to depend on intuition or guesswork to decide how much of an investment is needed to tackle a particular barrier. Instead, they know exactly what and how much is needed to overcome specific obstacles.
Reporting Automated
Our platform features Generative AI report-writing capability. It leverages the latest ChatGPT version to read the result of the analysis to compose the writing for the insight, which can also be downloaded as Powerpoint presentation along with the figures and visuals generated from the model. Our aim is to significantly reduce the time and effort required for report writing. Your presentation and report are ready to go!
Platform Walkthrough
A step-by-step user-friendly interface running machine learning algorithm for insight to plan for the right scenario to overcome your workforce challenges. Our Pay Equity AI platform shares a very similar interface.
Step 1: Instruction of using the platform – just in case we missed anything in the onboarding process
Step 2: Upload your data – Drag and drop your latest workforce data here
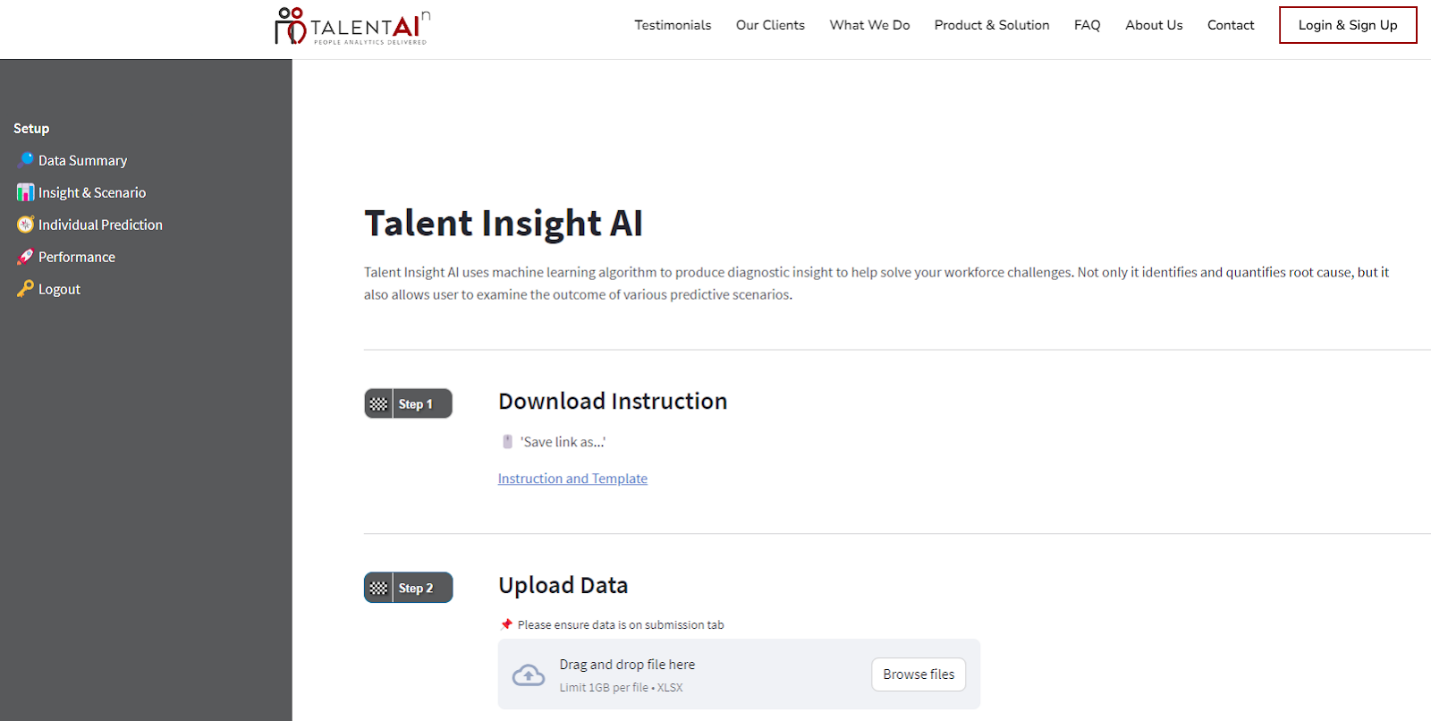
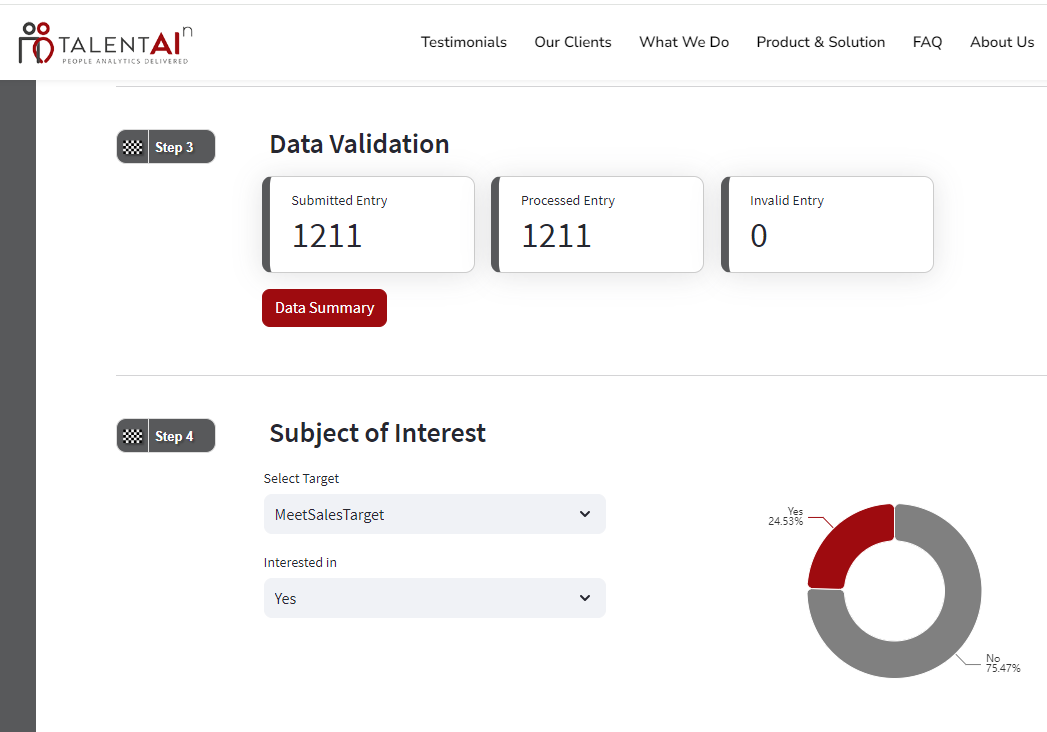
Step 4: Subject of Interest – Select the workforce challenge (dependent variable) that you’d like to examine
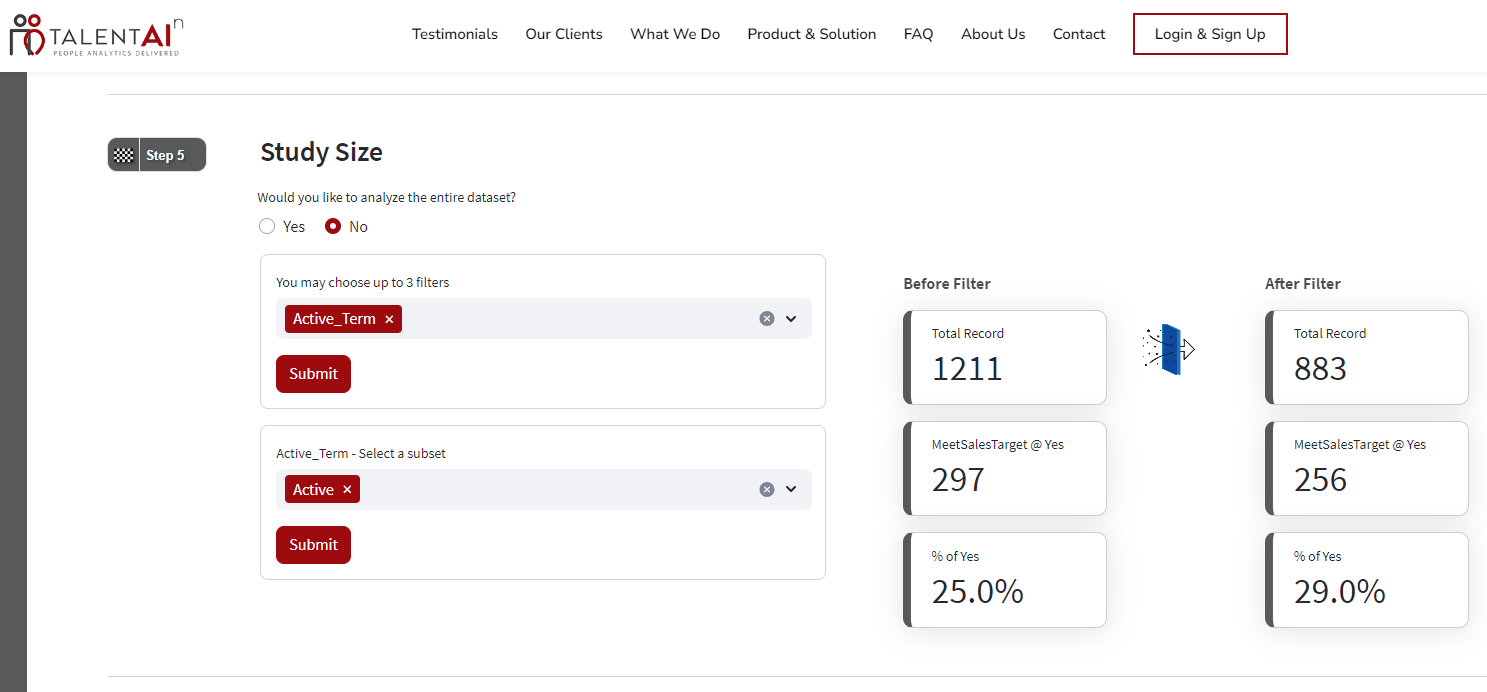
Step 7: Run the Machine Learning Algorithm!
Ready to see how Talent Insight AI can solve your workforce challenges? Schedule a live demo with our team and start turning data into decisions.

